Scalable and convenient Ganglia Nagios integration
Is simplicity a priority for you in network design? Would you prefer to have a single, lightweight monitoring agent that can provide both performance and availability metrics, while guaranteeing the minimum impact on the hosts being monitored?
Nagios is phenomenally popular for network state monitoring, while Ganglia has become the go-to solution for performance monitoring (using the legendary rrdtool to store and graph metrics).
Nagios has typically required the assistance of other agents, such as NRPE, to remotely run checks on hosts and return availability data. NRPE requires additional effort to configure and maintain and doesn't provide a graphical view of performance data. The most important issue with NRPE is the additional network load and security implications: the Nagios host must be able to make TCP connections to all hosts on the network. The Ganglia agent, however, broadcasts its metrics using UDP: the monitored hosts do not need to accept TCP connections, eliminating one potential attack vector. Not using stateful TCP significantly reduces the resource impact of monitoring too.
Bridging the Ganglia world with Nagios

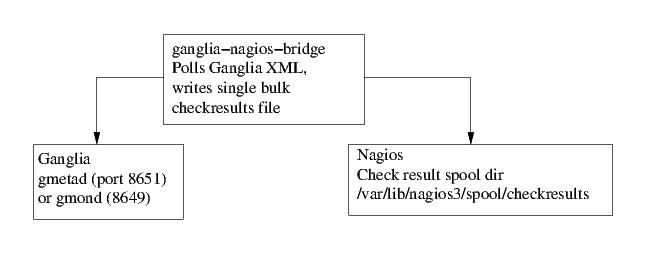
A Ganglia network typically includes one or more gmetad servers. The gmetad server can provide an XML document with the state of the whole network in a single TCP request (using port 8651 by default).
This single XML document may often provide all the information that is needed to populate the host and service status data in Nagios.
Other solutions for Ganglia / Nagios integration poll individual metrics through the Ganglia web interface. For a large network, this is not efficient and can put excessive load on the web server. Furthermore, it requires manually identifying and configuring individual metrics to poll.
ganglia-nagios-bridge was created to solve all these problems. ganglia-nagios-bridge can be invoked regularly (every 1-5 minutes usually) by cron. It could be easily converted to run as a daemon too. ganglia-nagios-bridge polls the entire Ganglia XML document for the network and efficiently parses it from top-to-bottom using a SAX parser.
It has a single configuration file where you can use regular expressions to specify what metrics you want from Ganglia and map them to services in Nagios.
After matching all the metrics and checking their state, ganglia-nagios-bridge writes them all into a single Nagios check result file in the checkresult spool directory. To avoid excessive and inefficient filesystem overhead, all the check results are concatenated into a single file for bulk processing by Nagios.
Getting started
Please see the documentation in the repository. Copy the script from the repository to your local Nagios system and away you go.